Reliability Fault Trees
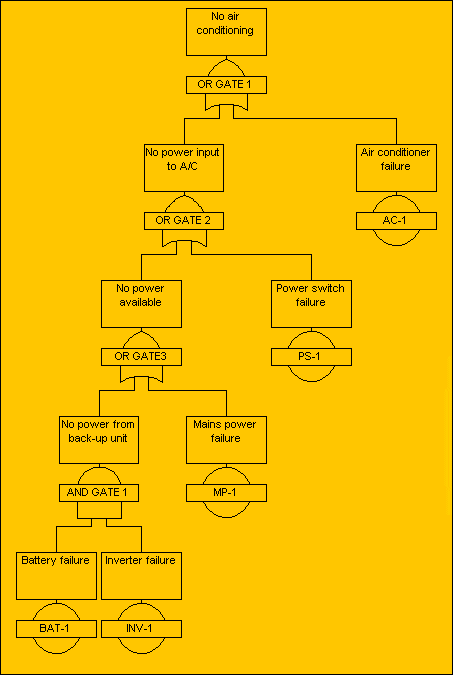
The fault tree diagramA graphical method of modelling the reliability of the system as AND and OR gates and failure events.. for the failure of air conditioning in a room is shown below. The reliability block diagram for the same system is shown in the previous section.
In the fault tree model the failure of modules/items are events and are represented as labelled circles. Gates (inverted shields) show how these faults combine to cause a failure of the service.

Optimal Solutions have considerable experience in developing reliability models, and welcome enquiries on Reliability. We would be pleased to provide consultancy tailored to your requirements. You can get in touch by sending a message from our Contact Us page, or by calling us on the number below.